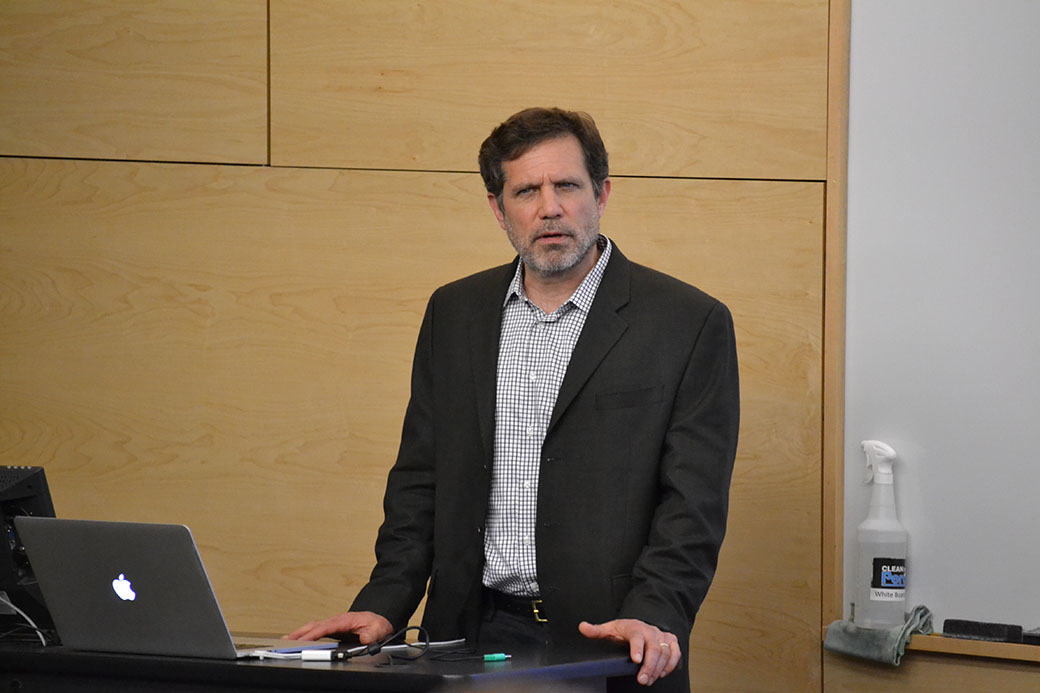
OSU professor presents research on climate change
Ed Brook was asked to play devil’s advocate to his own climate change research at the 17th Lifto Amundson Lecture, presented by the University of South Dakota’s Phi Beta Kappa Society April 19.
“Look at this data as if you were a climate change denier,” professor Mary Pat Bierle said. “Could you tell us what they were seeing or why they challenge this?”
Brook was quick in his response. He said he knows how he likes to respond to critics of climate change, giving them credit for tough questions but also refuting most arguments.
“One scientific criticism I’ve found interesting is ‘What if we’re missing a small detail? What if there’s actually 50 years of super high CO2 levels?’” Brook said. “We don’t measure every single year. That’s good criticism, but if you look at sea levels, you don’t see that sort of problem.”
Brook was the guest lecturer for the night’s presentation. Brook presented his lecture “History of Greenhouse Gases and Climate from Polar Ice Cores.”
Brook’s research at Oregon State University is helping to prove the extreme levels of greenhouse gas emissions in the atmosphere are unique to this time in history. Ice cores extract information on ancient climate through gas bubbles trapped in glacier ice.
The audience of about 100 students, alumni, faculty and general public were presented graphs and photos of greenhouse gas emission rates and ice core processing.
Junior Taylor Strasburg attended the lecture for a class. He said he was glad he chose the event over other lecture options because it verified some beliefs he had about climate change with hard evidence.
“It’s nice to get some empirical evidence regarding climate,” Strasburg said. “I don’t actively seek information on the subject, but what I heard was convincing.”
Strasburg said one thing from Brook’s lecture that will stick with him is the graph of greenhouse gases. Today’s rates of carbon dioxide and nitrous oxide are at record-highs within the last million years, according to the graphs.
Another graph included a chart of potential yearly temperature change and rising sea levels. The lines on the graphs were based off what actions humans decided to take to cut or maintain fossil fuel usage, which causes greenhouse gas emissions.
Brook said he didn’t have all the answers for how the world is to solve this problem, but his research suggests big surprises will happen in sea levels.
“To be fair, when we predict things like what will happen in years to come, we are also predicting a range of error,” Brook said. “Maybe we’ll just skip the Earth’s next ice age. I don’t know.”

